


AI Hotel Recommendations are Noisy, But Not Random
TL;DR
- Ask an AI for hotel recommendations in a given city twice, an hour apart, and four times out of ten it names a different hotel first. Ask again a couple of days later and it is a similar story.
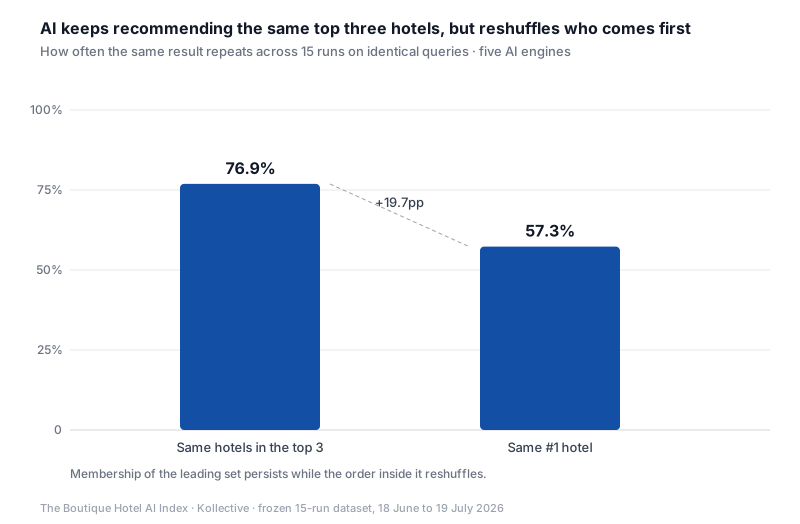
- The exact rankings list churns, but the shortlist of hotels behind it is far steadier: the same top three hotels reappear about three quarters of the time. Most of the “is AI stable?” argument is people measuring one of these and not the other.
- What kind of hotel you ask for matters a lot. Luxury hotel searches return the same names again and again; boutique hotel searches are wide open, and the five AI platforms we asked almost never agree between themselves.
- How you phrase your question changes the hotels in the list more than which country you ask from, and both change it more than simply waiting a few days to ask again.
- Underneath it all, a third of the hotels take nearly nine tenths of all mentions, and about ten hotels tend to dominate each city’s lists. The real game is getting into that stable pool and staying there, measured per platform, per search intent and per market, over repeated checks.
Fifteen times over a month, we asked five AI platforms to recommend some boutique, some romantic and some luxury hotels in 100 popular tourist destinations worldwide. One day we asked the same platforms the same questions just one hour later. Each Monday we also asked the same questions from three different geographical locations. We are interested in how and why AI engines appear to recommend hotels and if there are any discernable patterns that are noteworthy.
This is the first full-results piece from the Boutique Hotel AI Index, and it clarifies some of the questions our interim readout could only sketch: how stable or unstable AI hotel recommendations really are, whether any instability is randomness or genuine change, and whether the answer depends on which AI platform one asks, and which words a guest happens to use.
The short answer: AI hotel recommendations are two different worlds wearing one visible interface. There is a churning surface, where the number one hotel changes on four in ten identical queries asked an hour apart. And there is a stable core underneath: a third of the hotels carry seven eighths of all the visibility, and most of that core persists across the entire month.
Whether AI recommendations look nearly random or remarkably consistent depends entirely on which of the two worlds we measure. The first half of this piece measures the churn. The second half measures the core. The argument in the industry right now, we will suggest, is mostly measuring one half and generalising to the whole.
What We Measured
The numbers in this piece come from one frozen dataset. The main panel is 300 questions (100 destinations, three intents) put to five engines (ChatGPT, Gemini, Copilot, Google AI Mode, Google AI Overviews) fifteen times between 18 June and 19 July 2026: 22,500 answers.
Around it sit three control arms: a same-day repeat of the full panel (1,500 answers), three country sidebars (3,600 answers on the 20 largest destinations), and a ten-wording phrasing arm (1,000 answers). That is 28,600 answers in total.
Inside them we recorded 156,074 hotel naming events: one hotel named in one answer on one day. After merging name variants and removing the occasional non-hotel the engines offer instead of a hotel, those events resolve to 9,280 distinct hotels.
One term to hold onto: when we say two runs “agree,” we always say on what. Same-#1 agreement means the same hotel in first position. Top-3 set agreement means the same hotels somewhere in the top three, in any order. List overlap means the share of all named hotels reappearing. They behave very differently, and most of the industry’s disagreement about AI stability comes from comparing one of these to another without specifying which is which.
When Nothing Changes, the Answer Still Changes
Before we measured anything else, we measured our floor. On one day in July we ran the identical 1,500-query panel twice, about an hour apart, same setup, same accounts, same everything. It gave us what we call the noise floor: the amount of change you get when nothing has changed except an hour of our day.
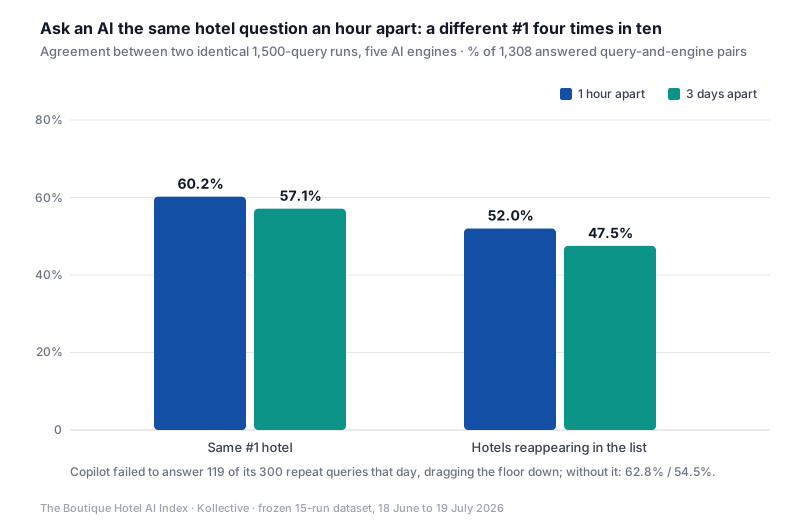
The floor is high. The same query returned the same number one hotel only 60.2% of the time (62.8% on the stricter basis explained in the disclosure box). Across full answer lists, about two in three hotels named the first time reappeared an hour later; the rest were swapped for others from a wider pool we will come back to. An hour of nothing happening moved four in ten top slots.
Rand Fishkin at SparkToro has highlighted this card-dealing behaviour outside hospitality: across 2,961 runs, the chance of two identical brand lists was under one in a hundred, and identical order was rarer still.
On our data the identical-list-in-order rate is 2.11%. It is highest on Copilot, at 6.5%, for the least flattering reason imaginable: Copilot’s median answer names only four hotels, and short lists repeat more easily. Consistency, where it appears, is largely just brevity.
So a first takeaway from our study, stated as consumer protection rather than science: a single screenshot of an AI answer is not a measurement. Hotel owners beware: when you search for your own hotel, you are seeing one deal of the cards.
Over Weeks, Noise Becomes Drift
If an hour of nothing moves four in ten top slots, is there anything left for time to do? The honest answer turned out to be more interesting than the one we expected.
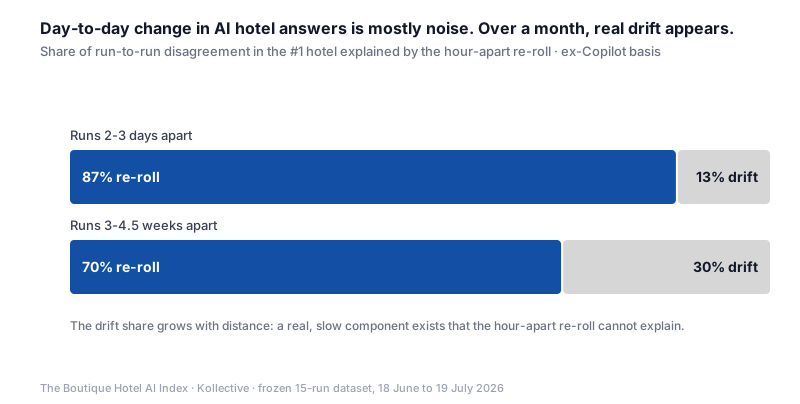
Day-to-day movement is mostly the platforms regenerating answers, not the market moving: the hour-apart re-roll explains about 87% of the disagreement between runs two to three days apart. But stretch the comparison to a month and it explains only about 70%. The remainder is real, slow drift, and it survives every exclusion we threw at it.
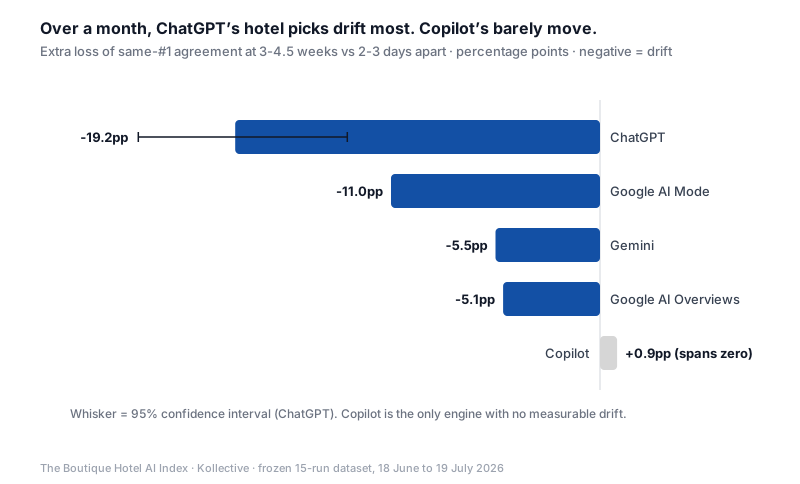
The drift is not evenly distributed. ChatGPT drifts hardest, by some distance. Gemini and Google’s AI surfaces drift gently. Copilot, alone, does not measurably drift at all. We are careful about what this does and does not mean: our data cannot separate the recommendation pool genuinely moving from the platforms changing models and plumbing under unchanged names. But the practical conclusion holds either way: “check your AI visibility once and file the screenshot” fails twice. Too noisy at short range, and genuinely out of date within weeks.
Luxury Has a Narrow Pool. Boutique Has a Wider One.
The numbers above are pooled. They hide the best finding in the study: how much churn you face depends on what kind of hotel is being asked for.
Ask for luxury hotels and the five engines reach same-#1 agreement for the same city 17% of the time. Ask for boutique hotels and it is 3.5%; romantic, 3.7%.
The mechanism is the width of the answer pool. Luxury queries draw on a median of 39 distinct hotels per query across the study and hold the steadiest answers, statistically at their own noise floor. Boutique queries draw on 52, churn hardest, and sit below their floor. Romantic draws on 56 and behaves like boutique. Answer length is not the driver: luxury and romantic answers are the same length, and twelve stability points apart.
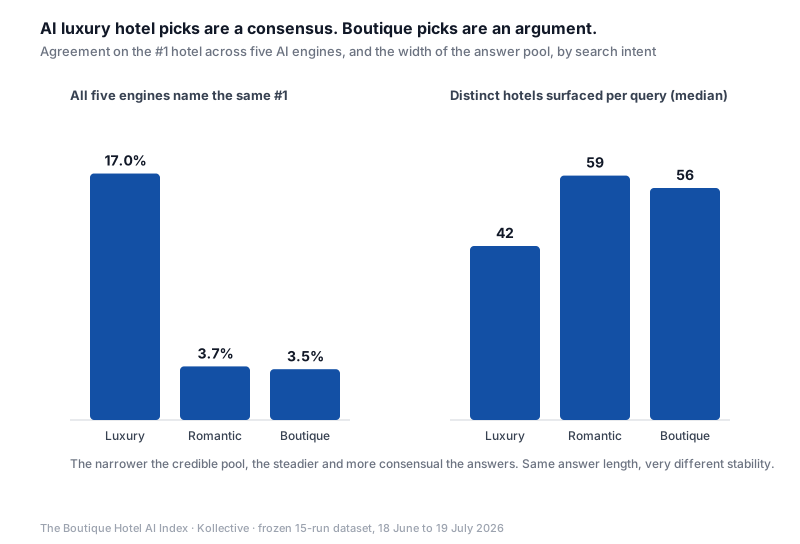
This is, we think, the finding hotel teams should actually act on. “Is AI visibility stable” is not answerable in general. It is answerable per conversation. The luxury conversation is narrow, consensual and slow-moving; if you are in it, defending presence is the game. The boutique conversation is wide, fragmented and re-dealt on every ask; no single answer, engine or week tells you anything on its own.
Phrasing Moves the Answer More Than Geography
Everything above holds the conditions fixed: same phrasing, US locale. real guests do not fit so neatly into these boxes. So we moved both dials on purpose: sidebar panels ran the identical questions from the UK, Australia and Singapore on the same days as the main panel, and a separate arm asked the same question ten different ways.
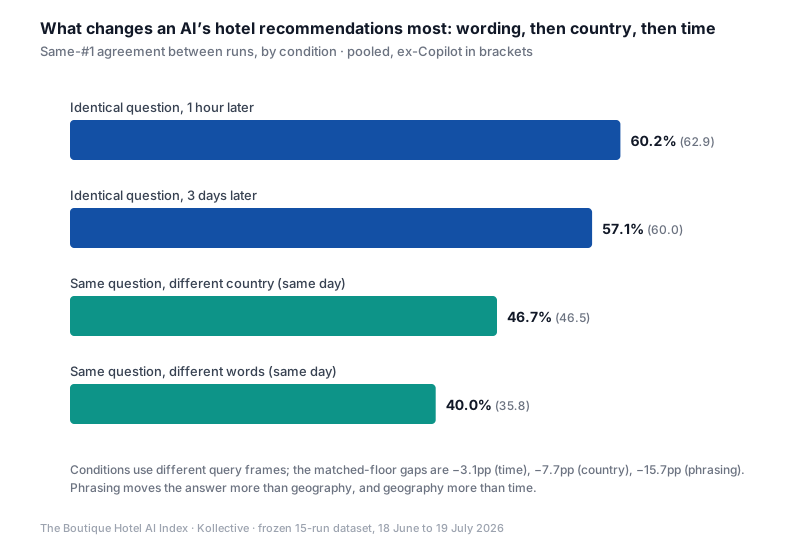
Both dials move the answer more than time does. Asking from another country produced same-#1 agreement of 46.7% against a matched same-day floor of 54.4%. Asking with different words produced 40.0% against a floor of 55.7%.
The whole first half of this post fits in one ladder: identical question an hour later, 60.2%. Three days later, 57.1%. Different country, same day, 46.7%. Different words, same day, 40.0%. Phrasing moves the answer more than geography, and geography more than time. (The conditions use different query frames, so the fair comparison is each condition against its own matched floor: about 3, 8 and 16 points respectively.)
For hotels whose guests book from three continents in a dozen phrasings, the implication is blunt: there is no such thing as “your AI visibility” in the singular, even within one engine and one intent. One pattern in the country data is striking enough that it gets a piece of its own shortly.
The Answers Churn. The Hotel Pool Persists.
Everything so far measures the answers, and the answers churn. Now count the hotels, and the picture inverts.
Across the month the platforms named 9,280 distinct hotels, and fifteen runs in, the pool was still growing: run 15 surfaced 201 hotels never named before. Discovery slows but never stops.
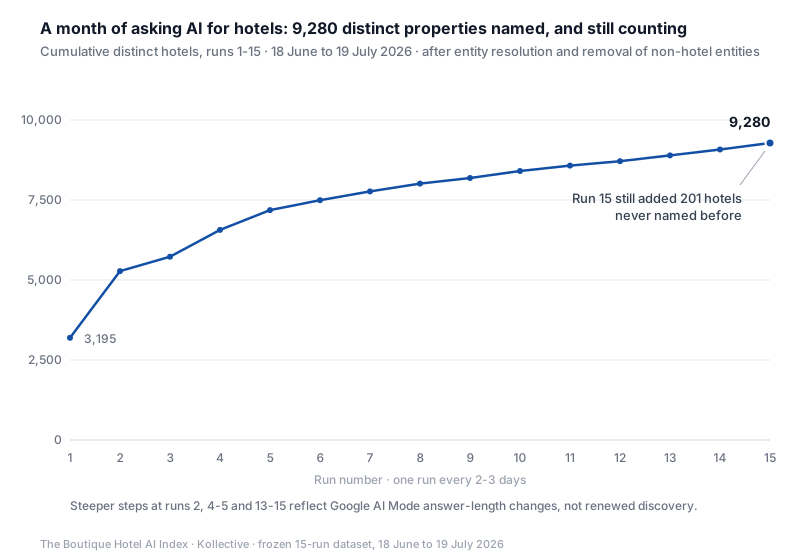
But the pool is not a blur. It is a barbell. At one end, a churning tail: a quarter of all hotels named (24.9%) appeared in a single run and never again, together they account for just 1.5% of all naming events.
At the other end, a stable core: hotels named in at least eight of our fifteen runs make up roughly a third of the pool (35.6%) and carry 88.0% of all naming events. We split the study in half to test whether that core is a counting artefact, and it is not: about three quarters of the first fortnight’s core is still the core a fortnight later.
This is the deck the platforms deal from. The hand changes on every ask. The deck mostly does not.
One engine deserves its own sentence: Google AI Overviews has the loosest pool in the study (37.6% of its hotels are one-run wonders; its core carries only 65.1% of its mentions), which fits its position as the least stable engine throughout.
A Select Few Hotels Take Most AI Visibility Per Destination
Concentration has a global version and a local version, and the local one should keep hoteliers up at night.
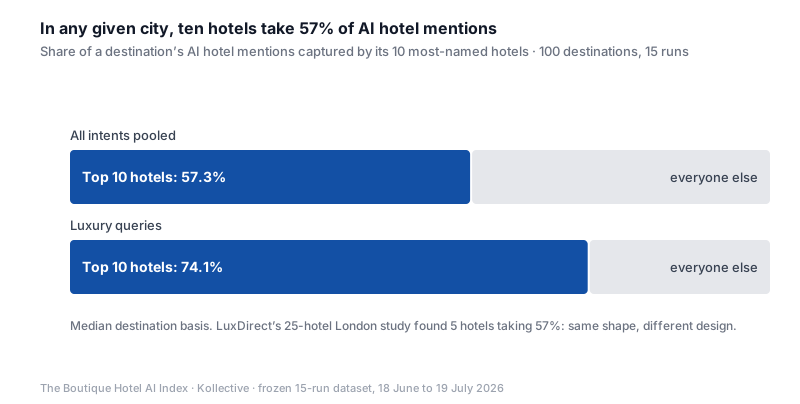
Globally, our top 100 hotels take 10.6% of all naming events. Locally is where it bites: within a single destination, the ten most-named hotels take 57.3% of that destination’s AI mentions. For luxury recommendations that rises to 74.1%. A 25-hotel London study by LuxDirect found five hotels taking 57% of AI recommendations; a different design converging on the same shape.
The AI hotel conversation in any given city is a conversation about a short list of named stars, plus a long tail of walk-on parts.
Put the two halves of this piece together and the picture is stark: the visible churn happens mostly inside and around a small persistent core, while the tail flickers in and out without accumulating visibility. Getting named once is easy, to the tune of two thousand one-off hotels. Staying named is the entire game.
Why Hotel AI Visibility Can Look Stable & Unstable at the Same Time
Why do hotel AI visibility studies sometimes appear to contradict each other? Usually because they are measuring different units: the #1 slot, the top set, brand-level visibility, property-level visibility, or repeated presence over time.
A study measuring whether the same hotels stay in the consideration set will always find more stability than one measuring whether the exact same hotel keeps first position. With that in mind, the disagreements in the field mostly resolve themselves.
HotelWorld AI reports consistency “above 88%” for top properties and concludes the inconsistency debate barely applies to hospitality. On our data, top-3 set agreement holds 77.0% across runs while same-#1 agreement holds 57.3%, on identical prompts: the set is nearly 20 points stickier than the slot. Add that their index measures chain brands, with independents largely excluded by construction, and both results can be true at once. Different unit, different metric, different population.
Nicolas Sitter published the first hospitality-specific consistency stat we know of: 50.5% same-first-hotel on Google AI Mode repeats, across templates that mix budget and family intents with our boutique and luxury. Our matched construct on AI Mode lands at 64.7%; the mixing likely pulls his average down, and the churn he found is the churn we find. And SparkToro’s mechanism, that consistency rises when the credible set of answers is narrow, is exactly what our section 4 shows with hotel numbers attached.
Measure the hand and AI looks random. Measure the deck, or aggregate to brands, and it looks consistent. Both measurements are correct. Neither is the whole story.
What Hotel Teams Should Measure Now
Three conclusions we act on with our own clients, upgraded from the interim post with the final numbers.
First, measure per engine, per intent, across repeats, or not at all. The five engines reach same-#1 agreement 8.9% of the time; 54.8% of hotels in the study appear on one engine only. A pooled “AI visibility score” averages away everything decision-relevant.
Second, choose your conversations. Luxury, boutique and romantic are different rooms with different rules: different pools, different stability, different chain presence. The words guests use decide which room you are competing in, and the strategies may not transfer.
Third, the goal is the deck, not the hand. Chasing the number one slot in a system that re-deals it hourly is astrology. Joining the third of hotels that carry seven eighths of the visibility, and staying there across weeks, is a real objective with a real measurement: share of repeated asks in which you appear, per engine, per intent, per market.
Next in this series: which sources the engines lean on for these answers, by engine and by intent.
Disclosure Box
Same-day floor basis and the Copilot companion figure: the floor is 60.2% same #1 / 52.0% list overlap (n=1,308/1,309 answered query-and-engine pairs). Copilot returned no fresh list on 119 of its 300 same-day cells; its floor rests on the remaining 181. Because that failure depresses the floor while Copilot’s cross-run data is intact, including it flatters the “it’s all noise” reading. We therefore show the stricter ex-Copilot pair (62.8% / 54.5%) wherever the floor appears, and per-intent claims use ex-Copilot cells. The failure was date-linked (6 July 2026, affecting four secondary collection runs; the main panel was unaffected).
Confidence intervals: headline comparisons carry bootstrap 95% intervals; they are shown on the charts and in the methodology annex rather than inline. The month-distance drift is −7.2pp [−8.8, −5.6]; the country effect −7.7pp [−13.1, −2.3] pooled, −10.2pp ex-Copilot; the phrasing effect −15.7pp. Copilot run 12 captured 151/300 cells; affected pairs are treated with caution.
Google AI Overviews produced no overview on roughly one in four boutique and romantic hotel queries; no-show cells are excluded, not imputed.
Google AI Mode answer formats changed twice during the study (short, long and mid-length list regimes). No cross-regime cells enter any stability or distinct-count comparison.
Non-hotel deflections (map providers, booking platforms and similar): 1,119 of 156,074 naming events (0.72%), skewed to AI Overviews and Copilot. Removed by default; the floor is identical with or without them, and no deflection ever reached the stable core. The 9,895 recorded entities reduce to 9,280 hotels on this basis.
Sidebar scale and design: the locale sidebars ran a 20-destination subset (60 queries per engine; 3,600 answers), same-day with main runs 1, 3, 9 and 15; all sidebar comparisons use the floor recomputed on those same 60 queries. Australia’s pooled interval touches zero and clears on the ex-Copilot basis. The Singapore arm’s region field carries a vestigial gb code; execution was verified genuinely Singapore, and the quirk does not carry any finding.
Phrasing arm basis: ten wordings, separate test brand, scored against the boutique-intent floor.
Drift attribution: real on four of five engines, but the design cannot separate genuine market movement from platform-side model and product changes under unchanged names.
The usual caveats: fixed English phrasings for the main panel, US locale, logged-out sessions; confirmatory claims (instability, floor decomposition, locale) were pre-specified; the set-vs-slot, persistence, concentration and per-bucket cuts are exploratory.
Correction policy: earlier interim figures were computed on raw hotel names and have been corrected on matched identities; the interim post carries the dated correction notes. Every figure in this piece is script-produced from the frozen 15-run dataset and traceable on request.
Kollective is a hospitality marketing agency. We sell hotel SEO and AI-visibility services, and this research informs that work.